Blog statistics after two years
Translations: Português (pt-BR)Wow, it's been two years since I've started this blog! I'm really happy that I've still managed to keep up the one post per month. Hopefully I'll be able to keep it up for the third one!
For this post I thought it would be fun to look through some statistics on what I've done on the blog so far. To make this possible I've created a 'stats' plugin for pelican that generates the statistics I'm interested in. I then wrote python scripts using matplotlib to plot the collected data.
Plots & Stats
I've managed to keep up with the monthly posting schedule, but I haven't been able to always post on the 20th of each month as I intended, and it shows here:
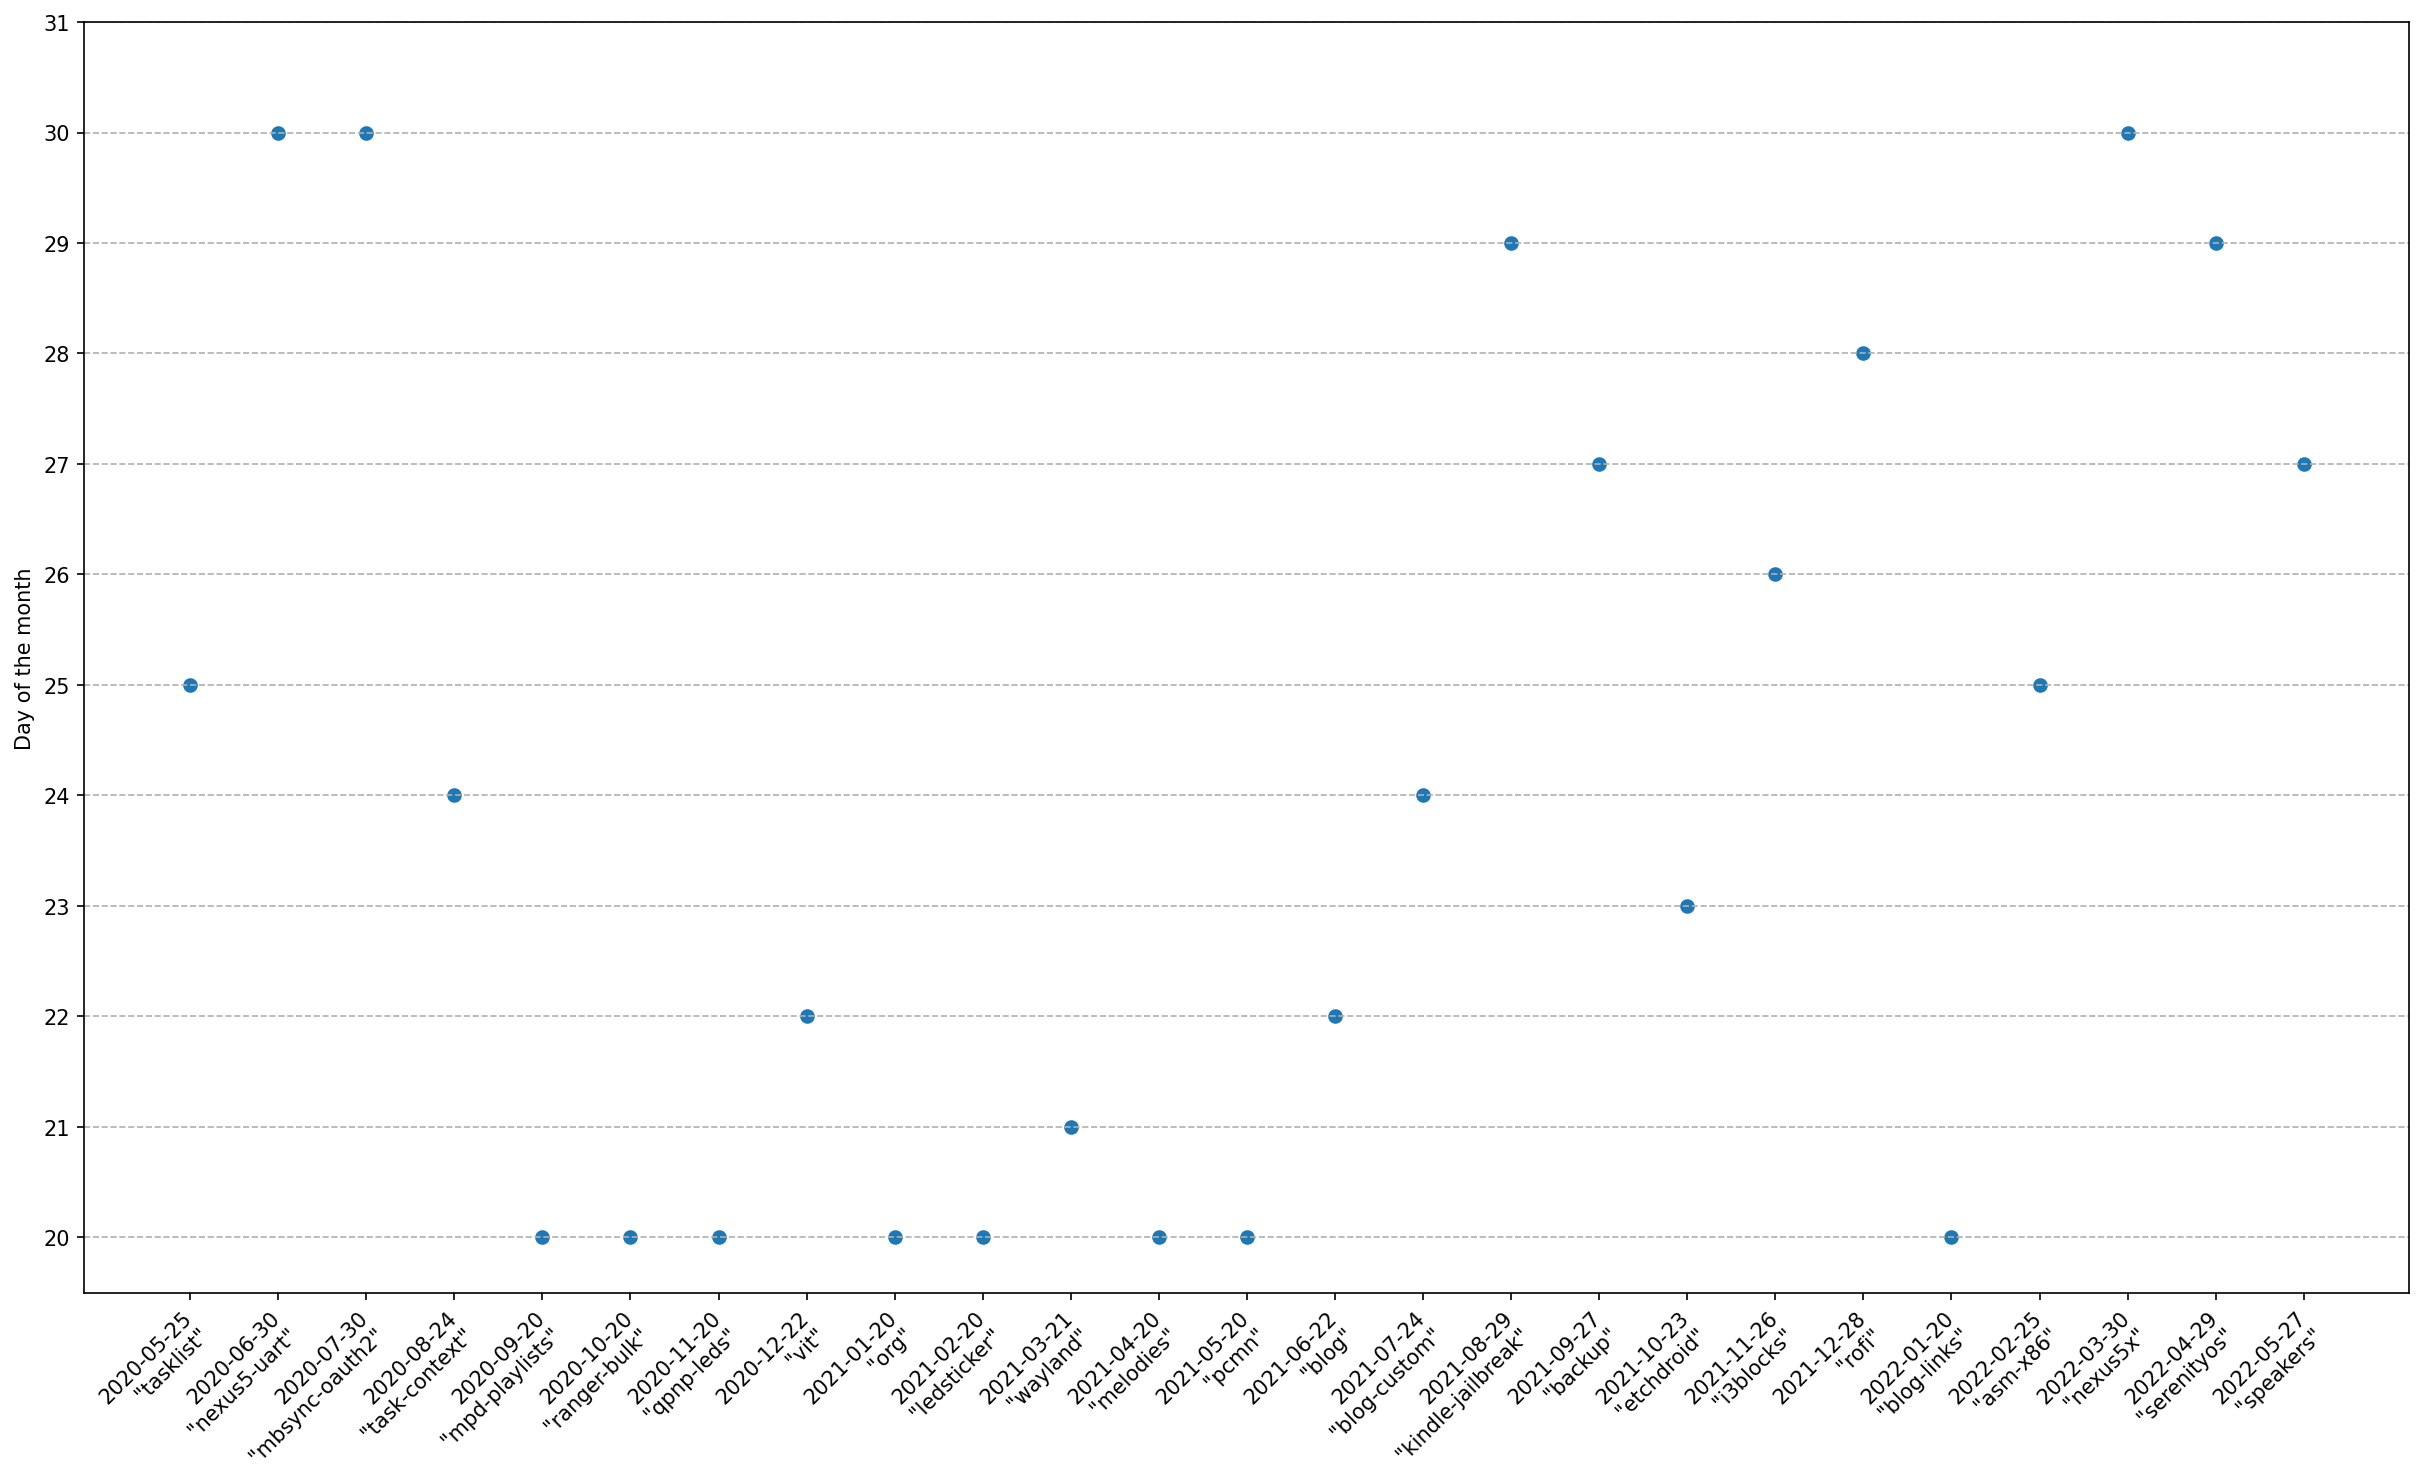
(Open the image in a new tab to see it better)
In the beginning I hadn't yet decided on a date to post each month, but starting with 2020's September post I settled on the 20th of each month and I managed to more or less keep that up until May of the following year. After that I've almost never again posted on the 20th, and there's even some kind of upwards slope as the posts have been sliding to the end of the months.
This other plot shows the total accumulated count on each day of the month:
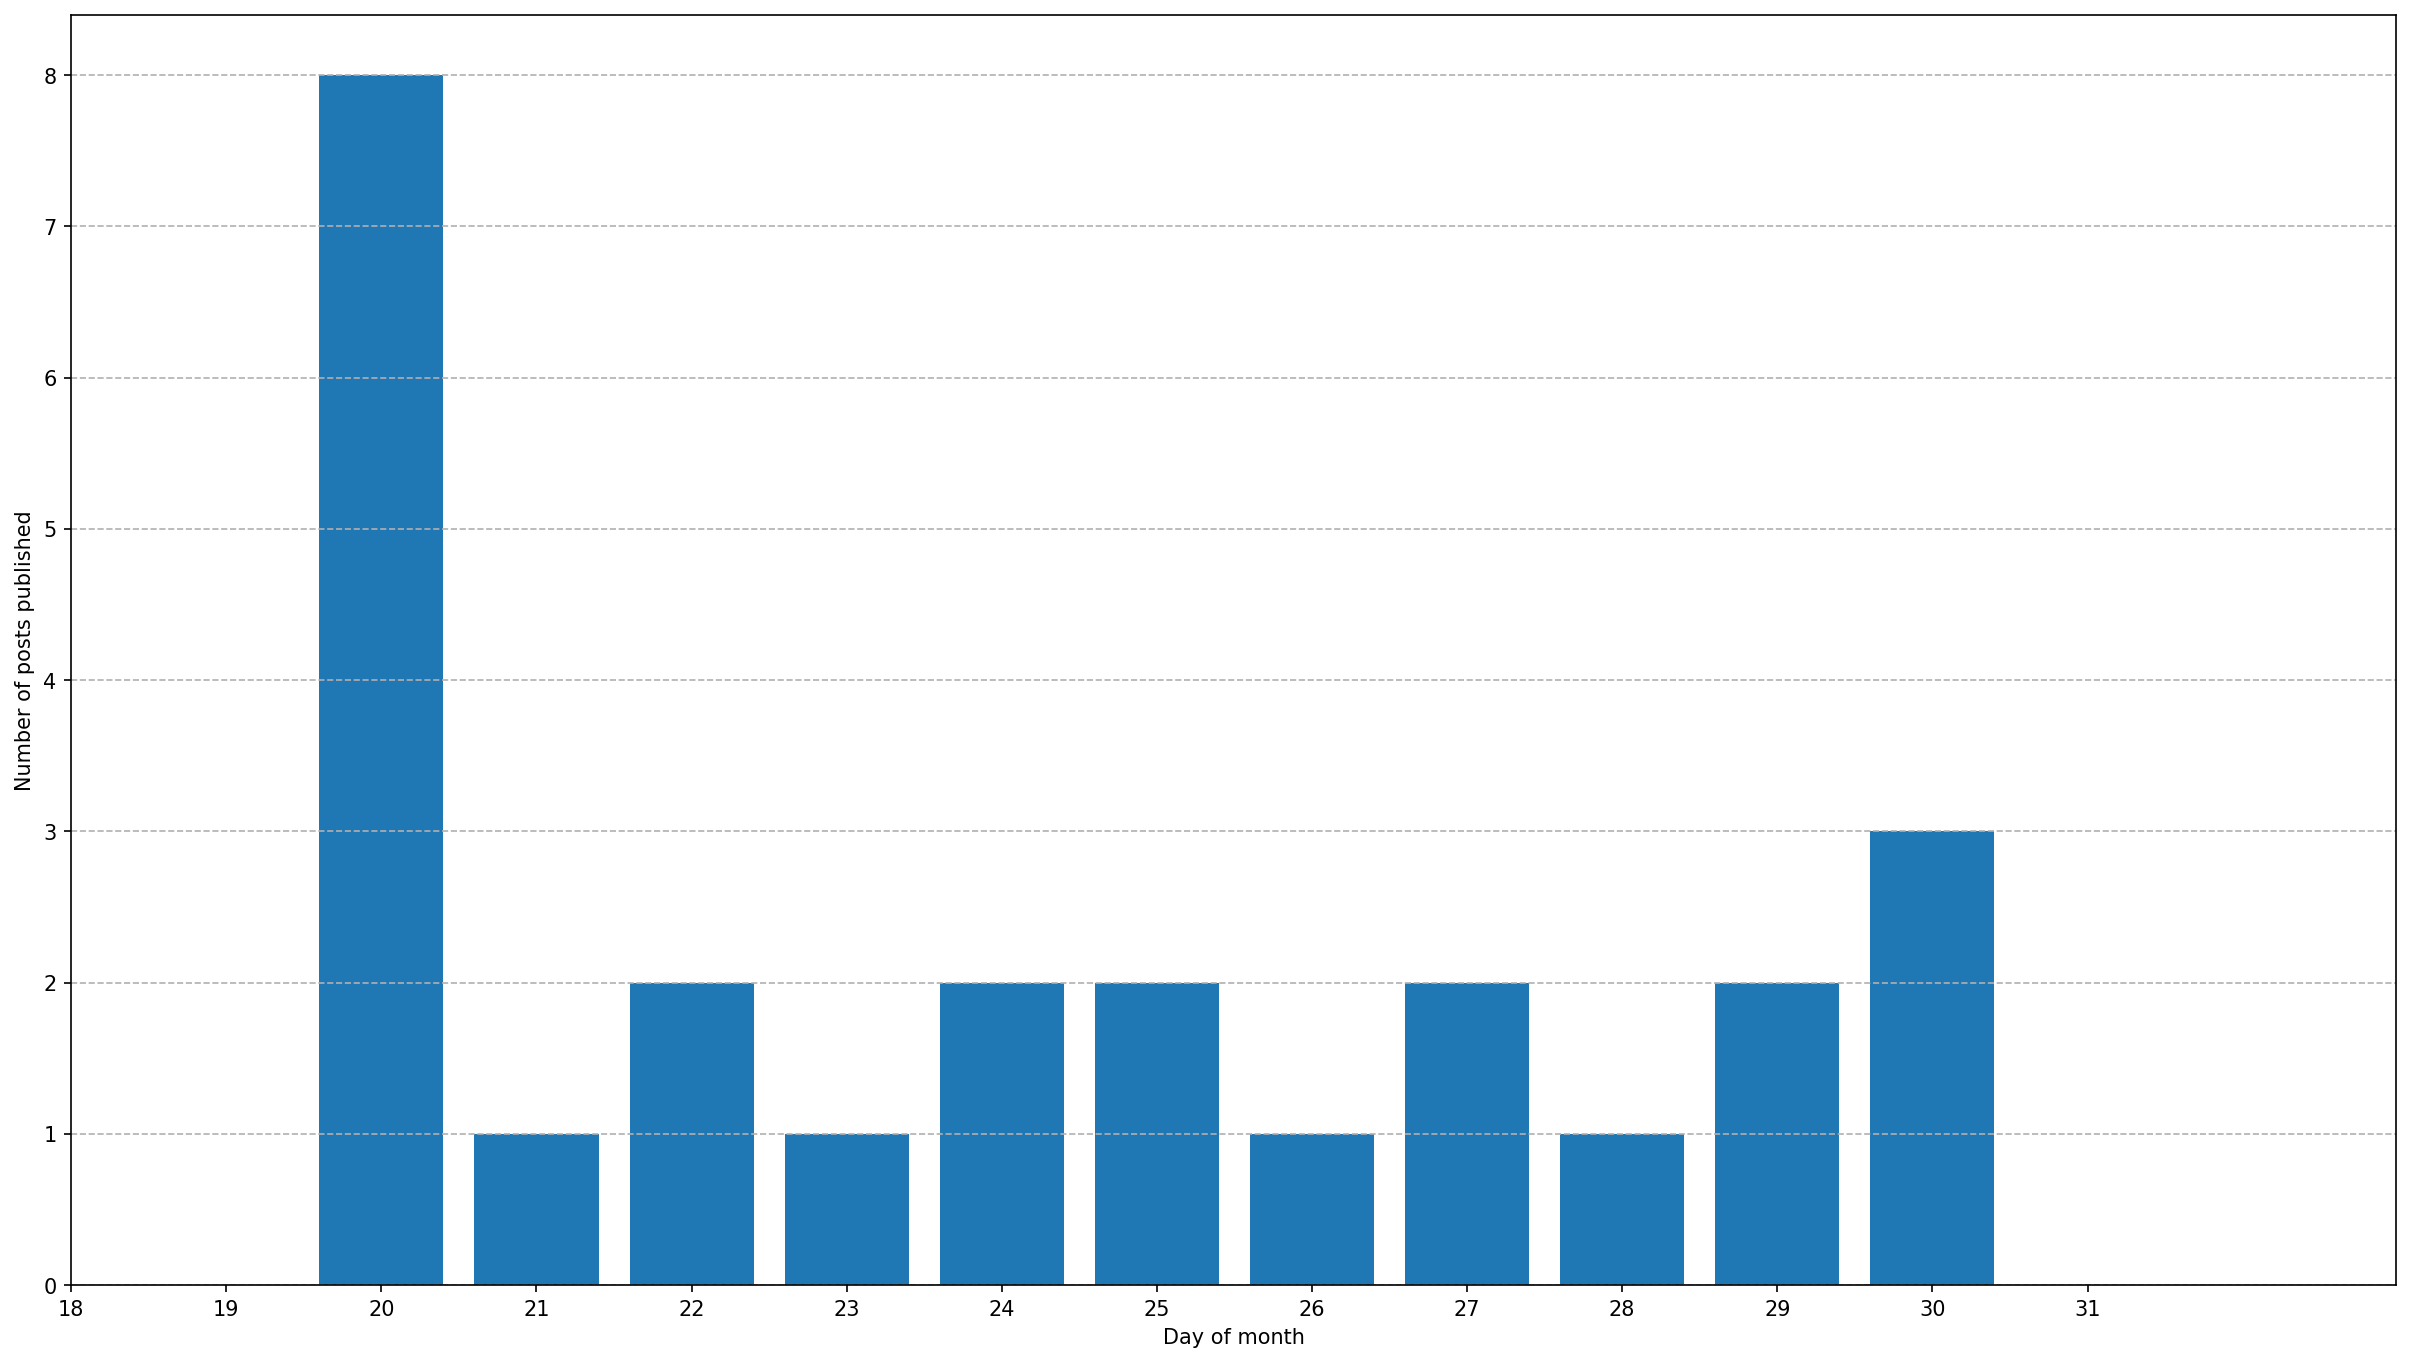
The 20th is still the day of the month I've posted the most on, with 8 on total, but there are more posts evenly distributed in the days after it, totalling 17! That's to say only about one third of my posts were published on the 20th like I intended.
This doesn't bother me much though. It would've been nice to keep the posts consistently going up on the same day, but posting every single month, whatever the date, is much more important to me, and I'm very happy I've been successful on that.
Changing subjects a bit, I always wanted to know the word count of the posts, so here it is:
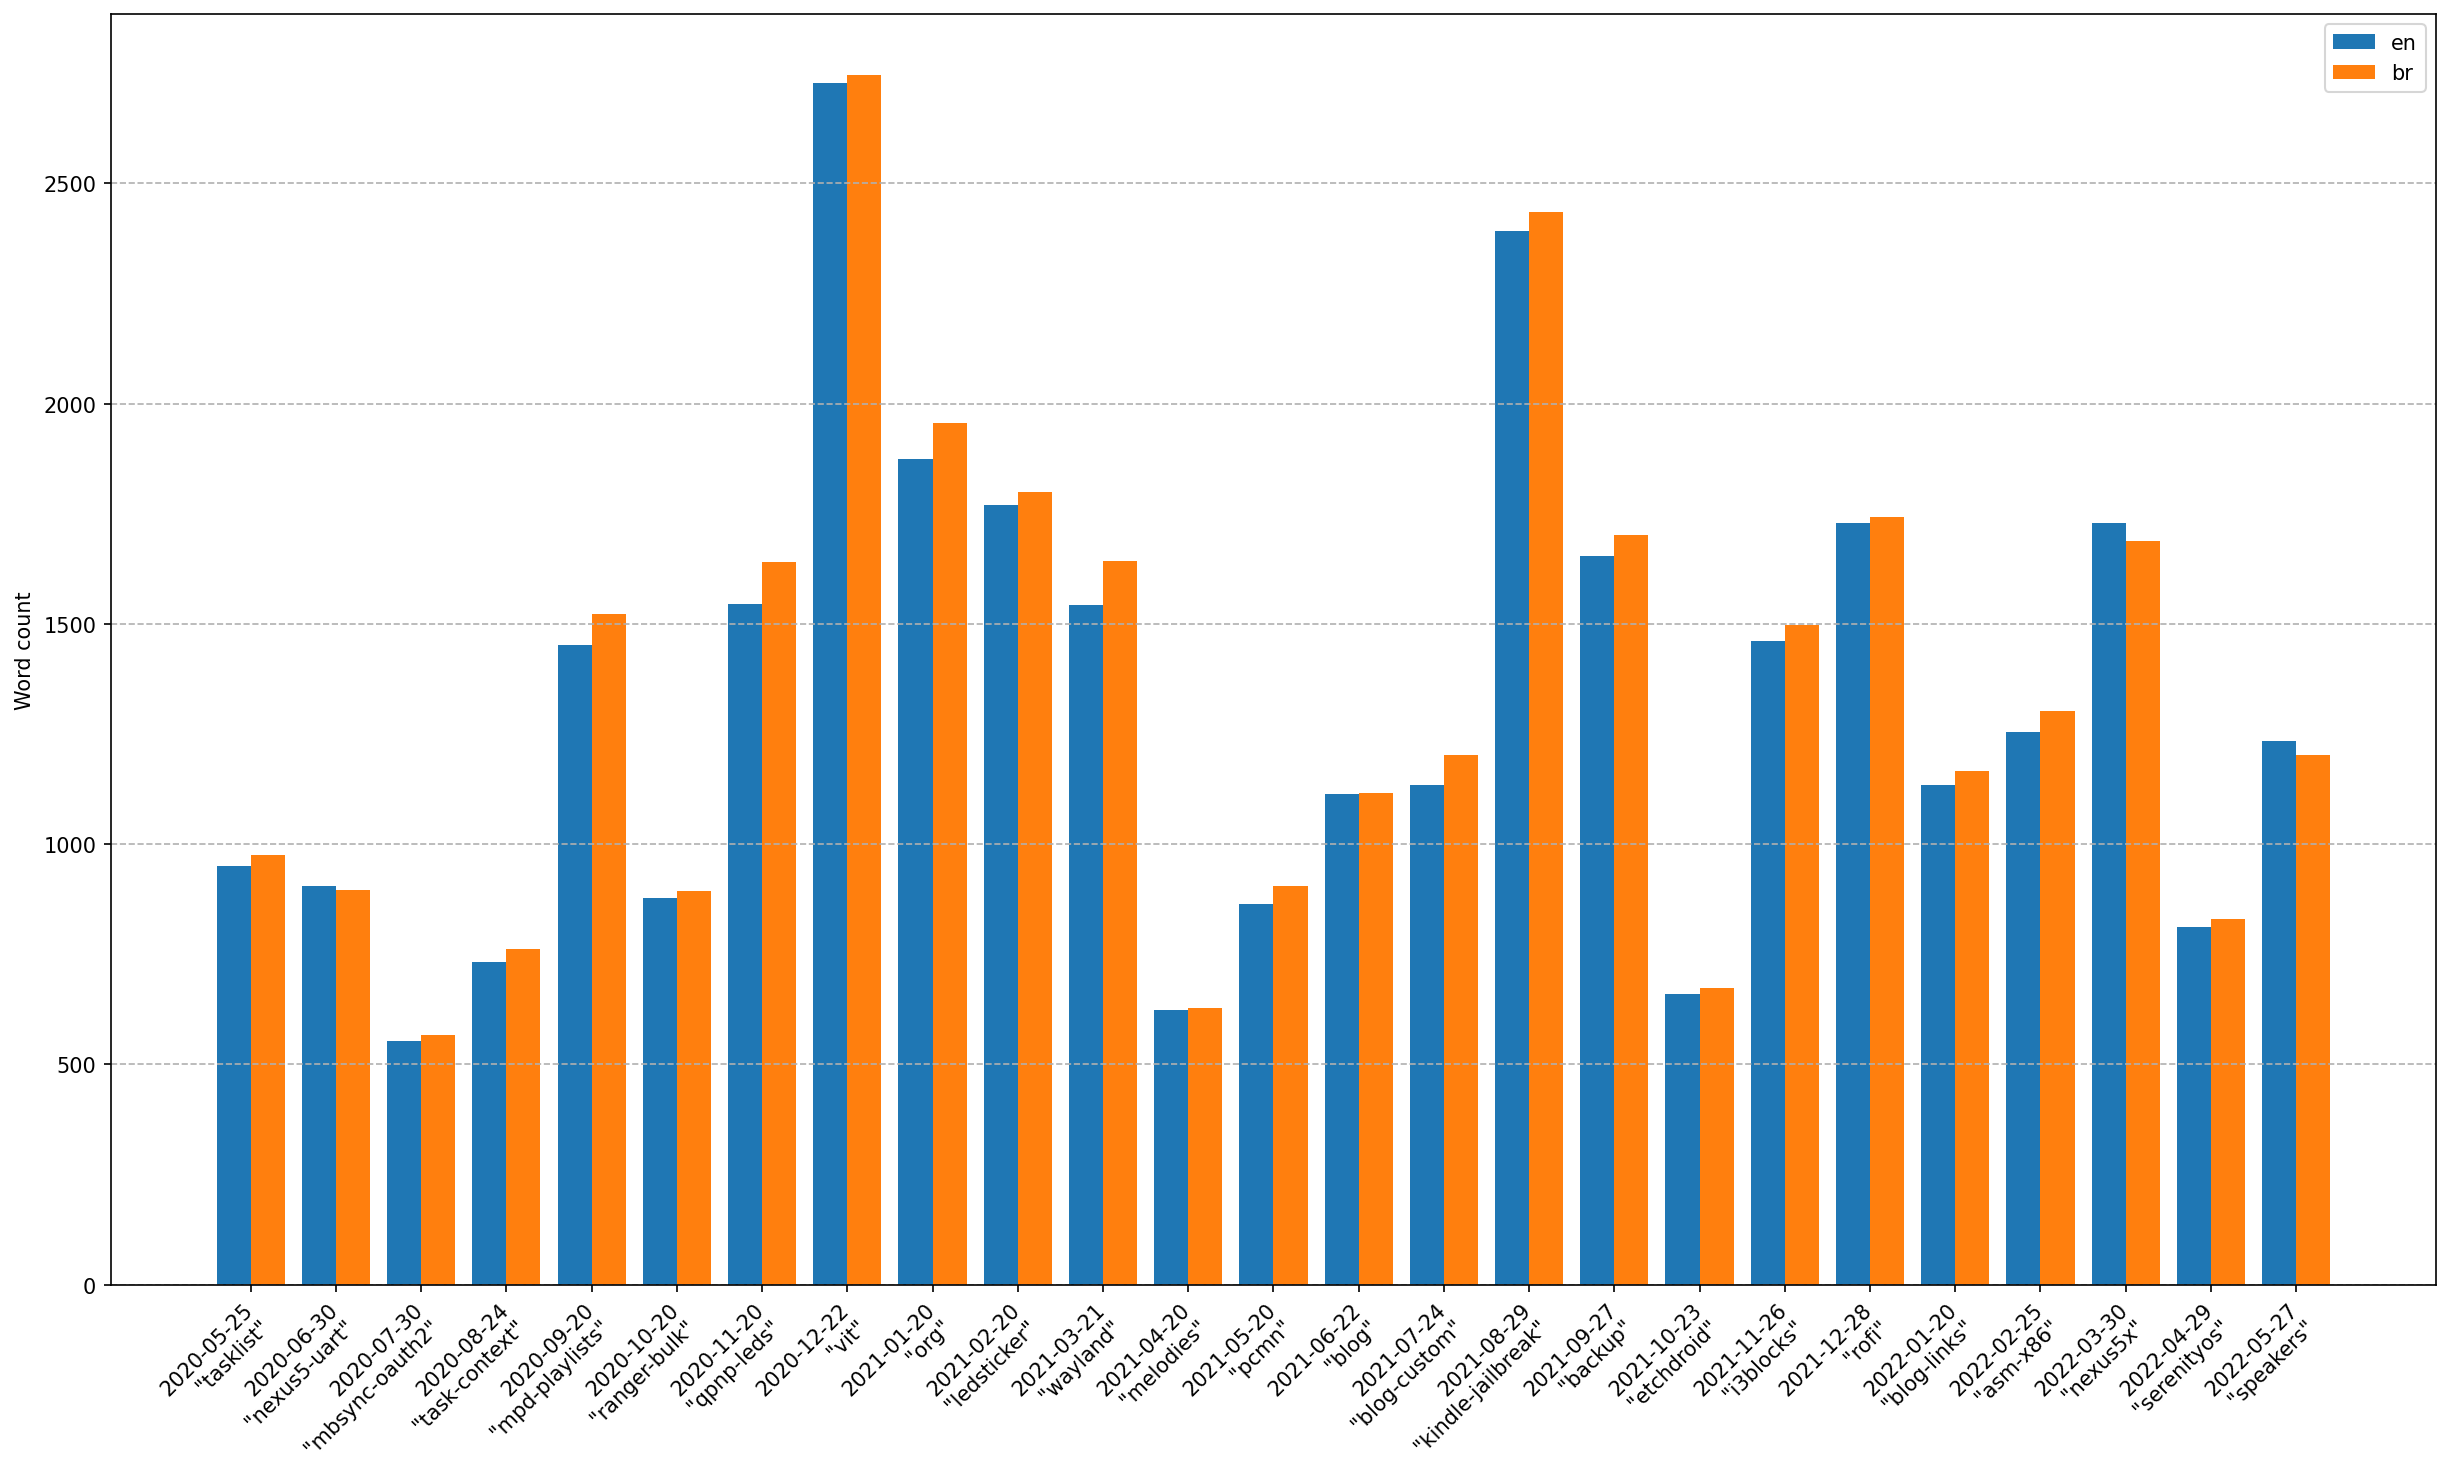
There's no clear tendency, which is what I expected. The smallest ever post was the "Setting up mbsync to work with XOAUTH2" post with 553 words in English and 567 words in Portuguese, while the largest one was the "Managing my tasks using VIT" post with a whopping 2727 words in English and 2747 words in Portuguese. The second largest post is the "Owning my Kindle" post not too far below, while all the rest are below the 2000 words mark.
This graph also allows for comparing the word count between English and Portuguese, and it's clear that the Portuguese version is almost always slightly bigger. This agrees with my perception, as multiple times I've increased the sentence's length as I try to express the same thing in Portuguese which in English I was able to express with a common technical term.
In total, all English posts sum up to 32718 words, while all Portuguese ones sum up to 33488 words. So my Portuguese posts are in average 2% larger, which is honestly less than I expected.
It is worth mentioning that this word count is done at the final generation stage of the article, when it is already in its HTML form, meaning that all the content that shows when it's published is there, with the difference that the HTML tags that could add to the count are stripped. In practice, this means that the total word count is the post's text plus the code blocks. So one important element that doesn't show up in this plot are the images, which can be seen here:
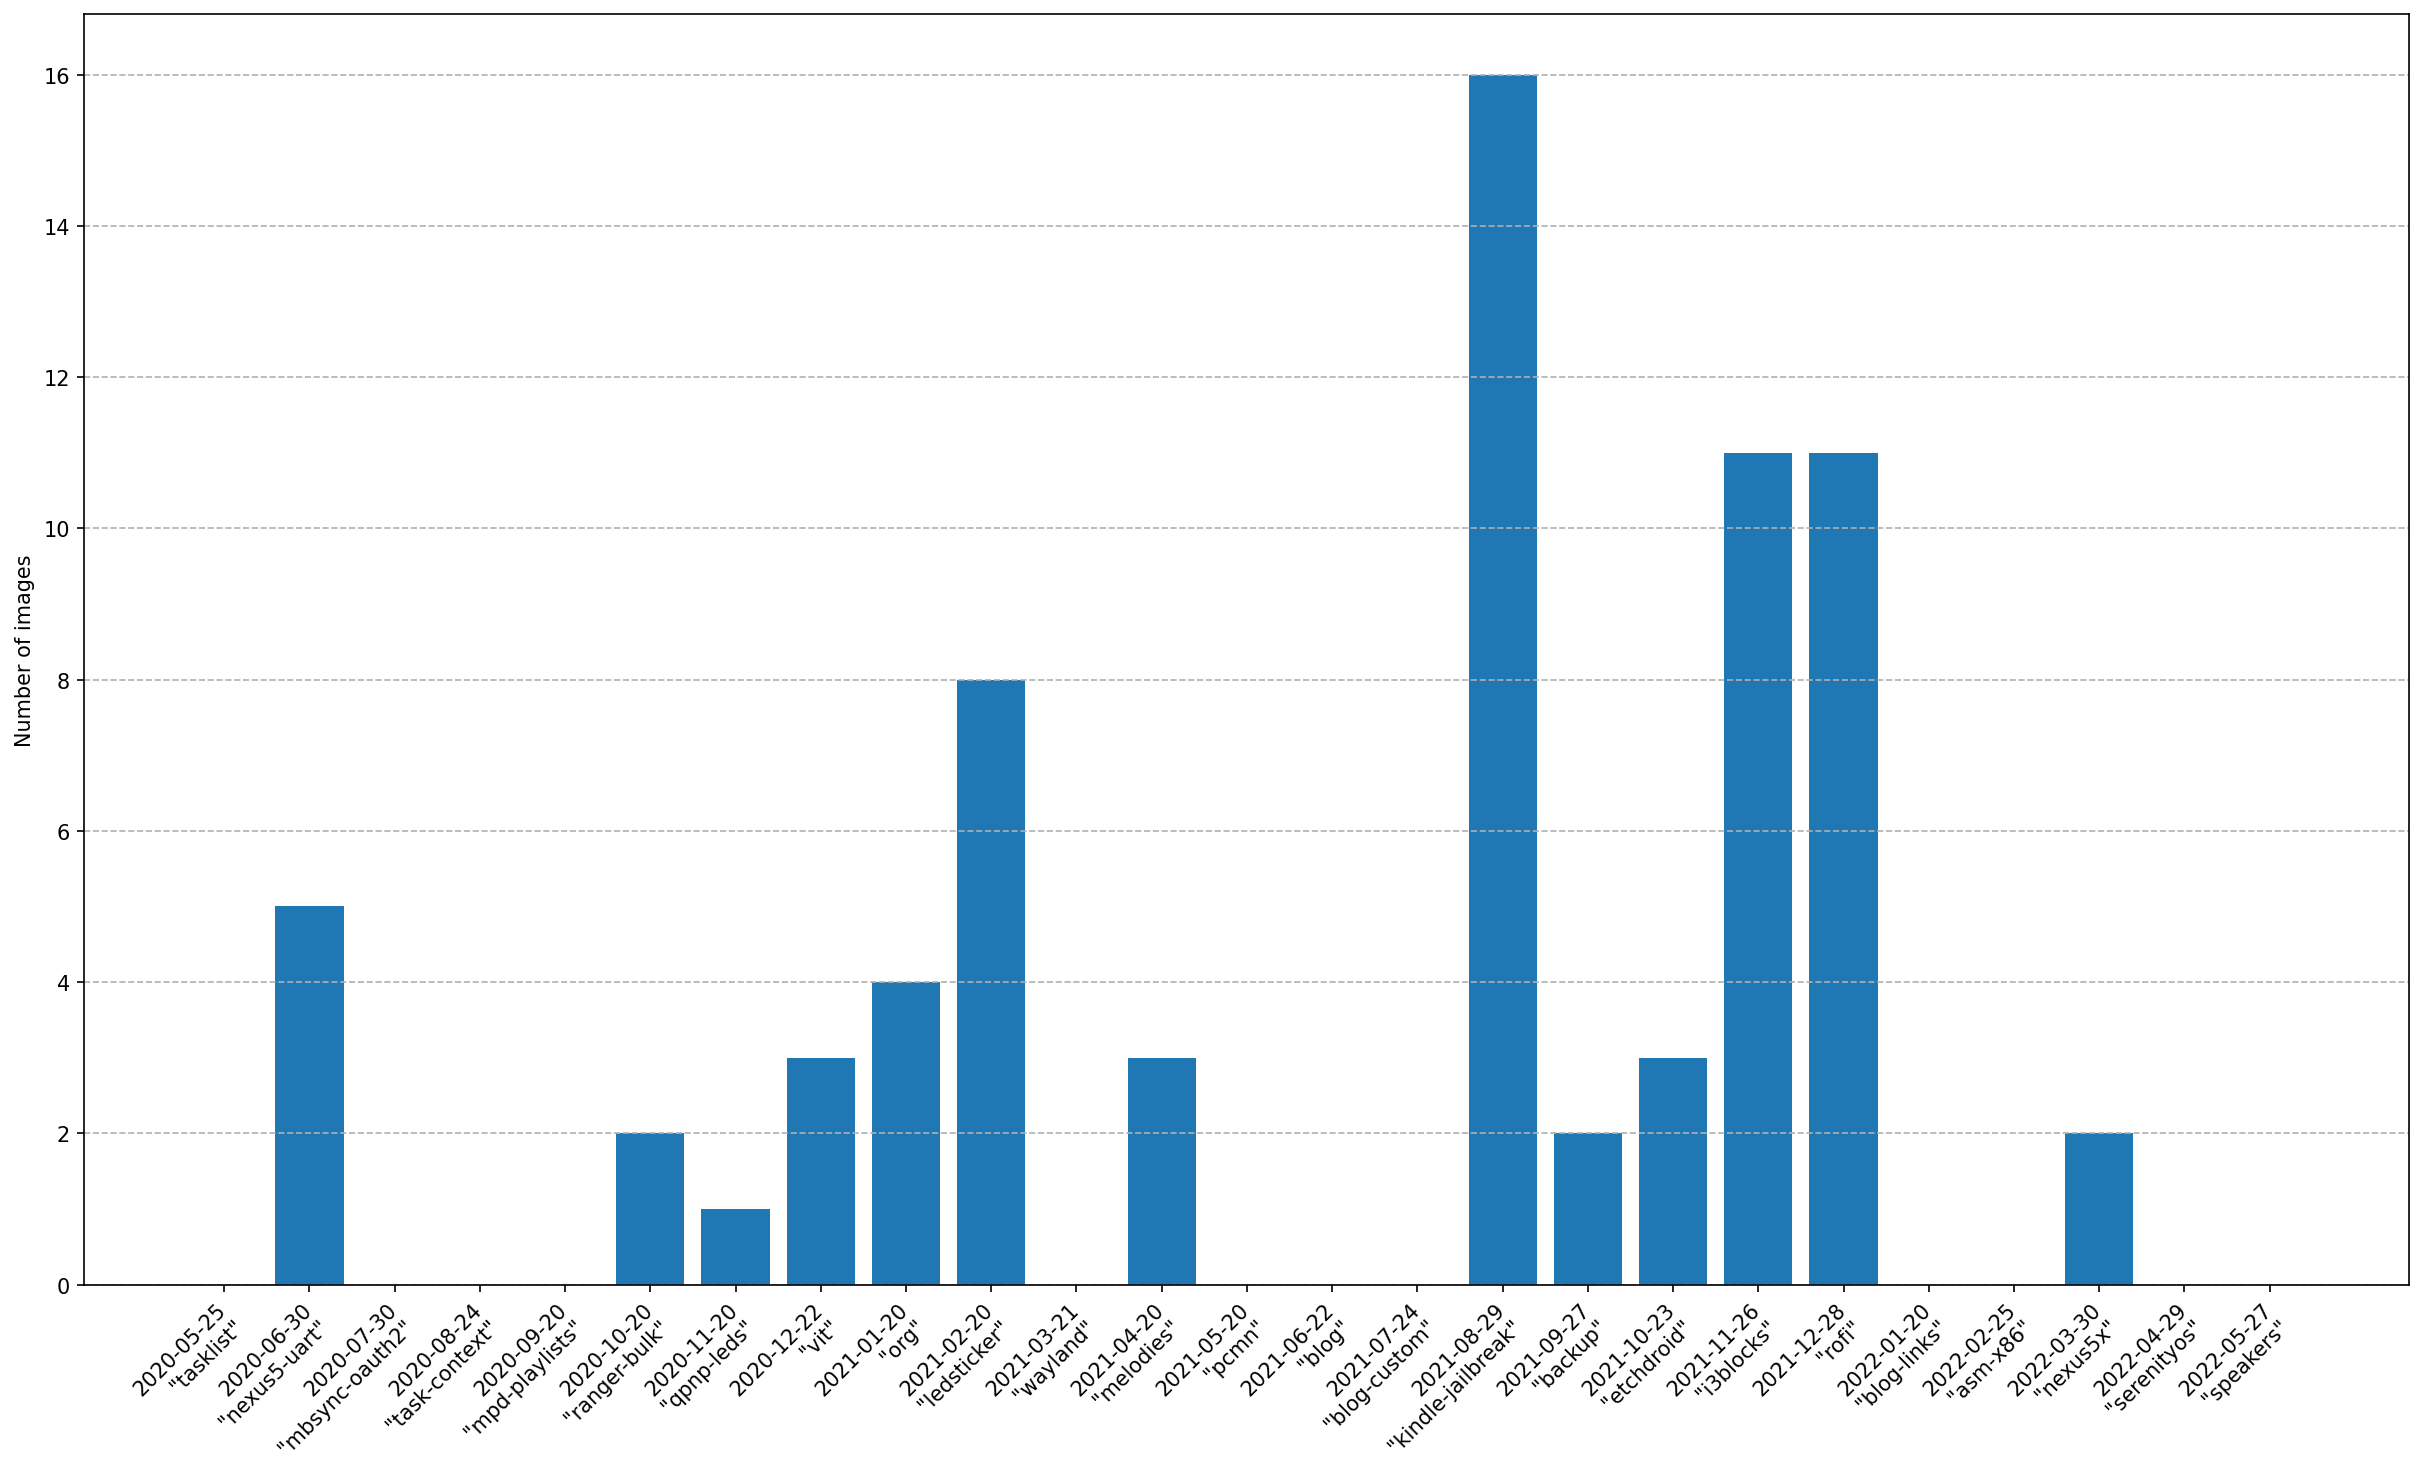
Not all of the posts have images, but some of them have quite a few! In fact, the "Owning my Kindle" post, which was the second largest post, is the one with the most images, 16 in total!
Now, this part is very arbitrary, but I wanted to account for the number of images in a post when comparing the amount of content in each one. They say a picture is worth a thousand words, but for my purposes that seems a bit excessive. Instead counting each image as 75 words, a normal paragraph, seems reasonable. I also decided to make GIFs be worth three times as much, 225 words, since their dynamic nature makes them much richer. With this in mind, I plotted the total content estimate of all posts:
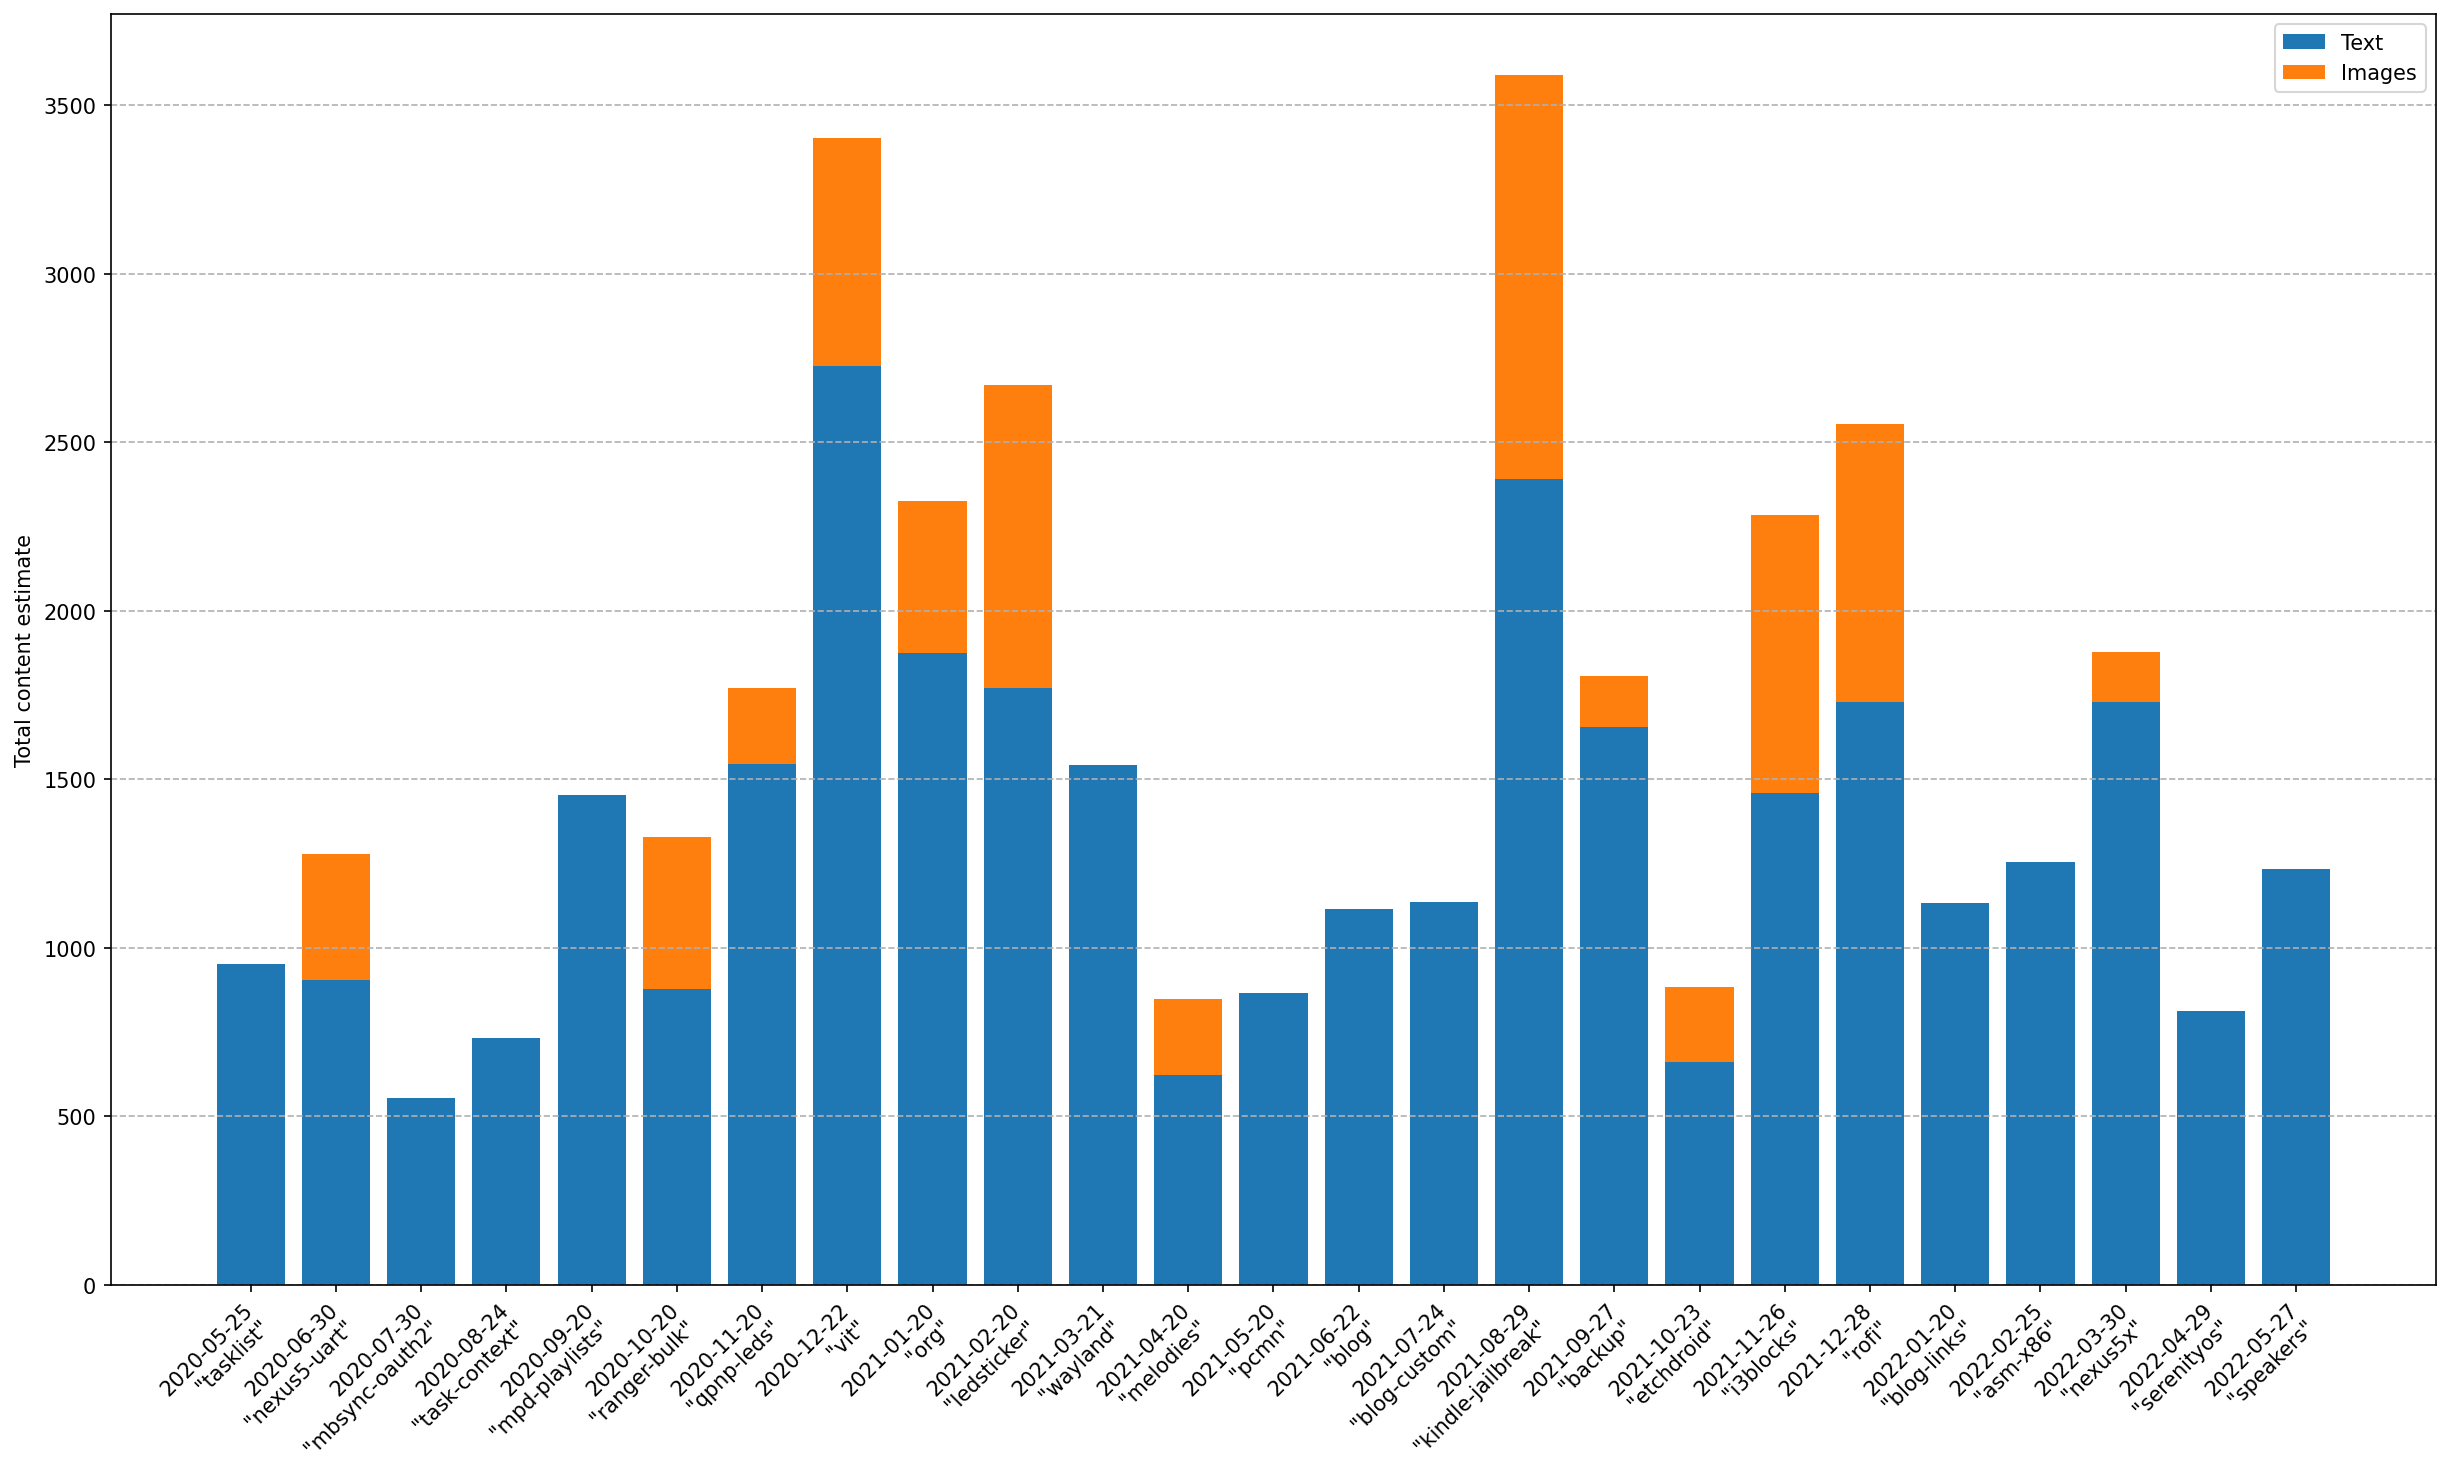
Again, the numbers are totally subjective, and this still doesn't account for the audio files I've composed and linked to in the "Learning music theory by writing melodies" post nor for the code that I wrote on some repository and just linked in the post, like in the "Keeping track of my packages" post. But given its limitations, I'd say this is much closer to my perception of how much content each post has.
A notable diference is that on this new plot, the "Owning my Kindle" post became the post with the most content.
Anyway, going back to more objective metrics, I plotted the number of links to other posts, or cross-references if you will, each post had:
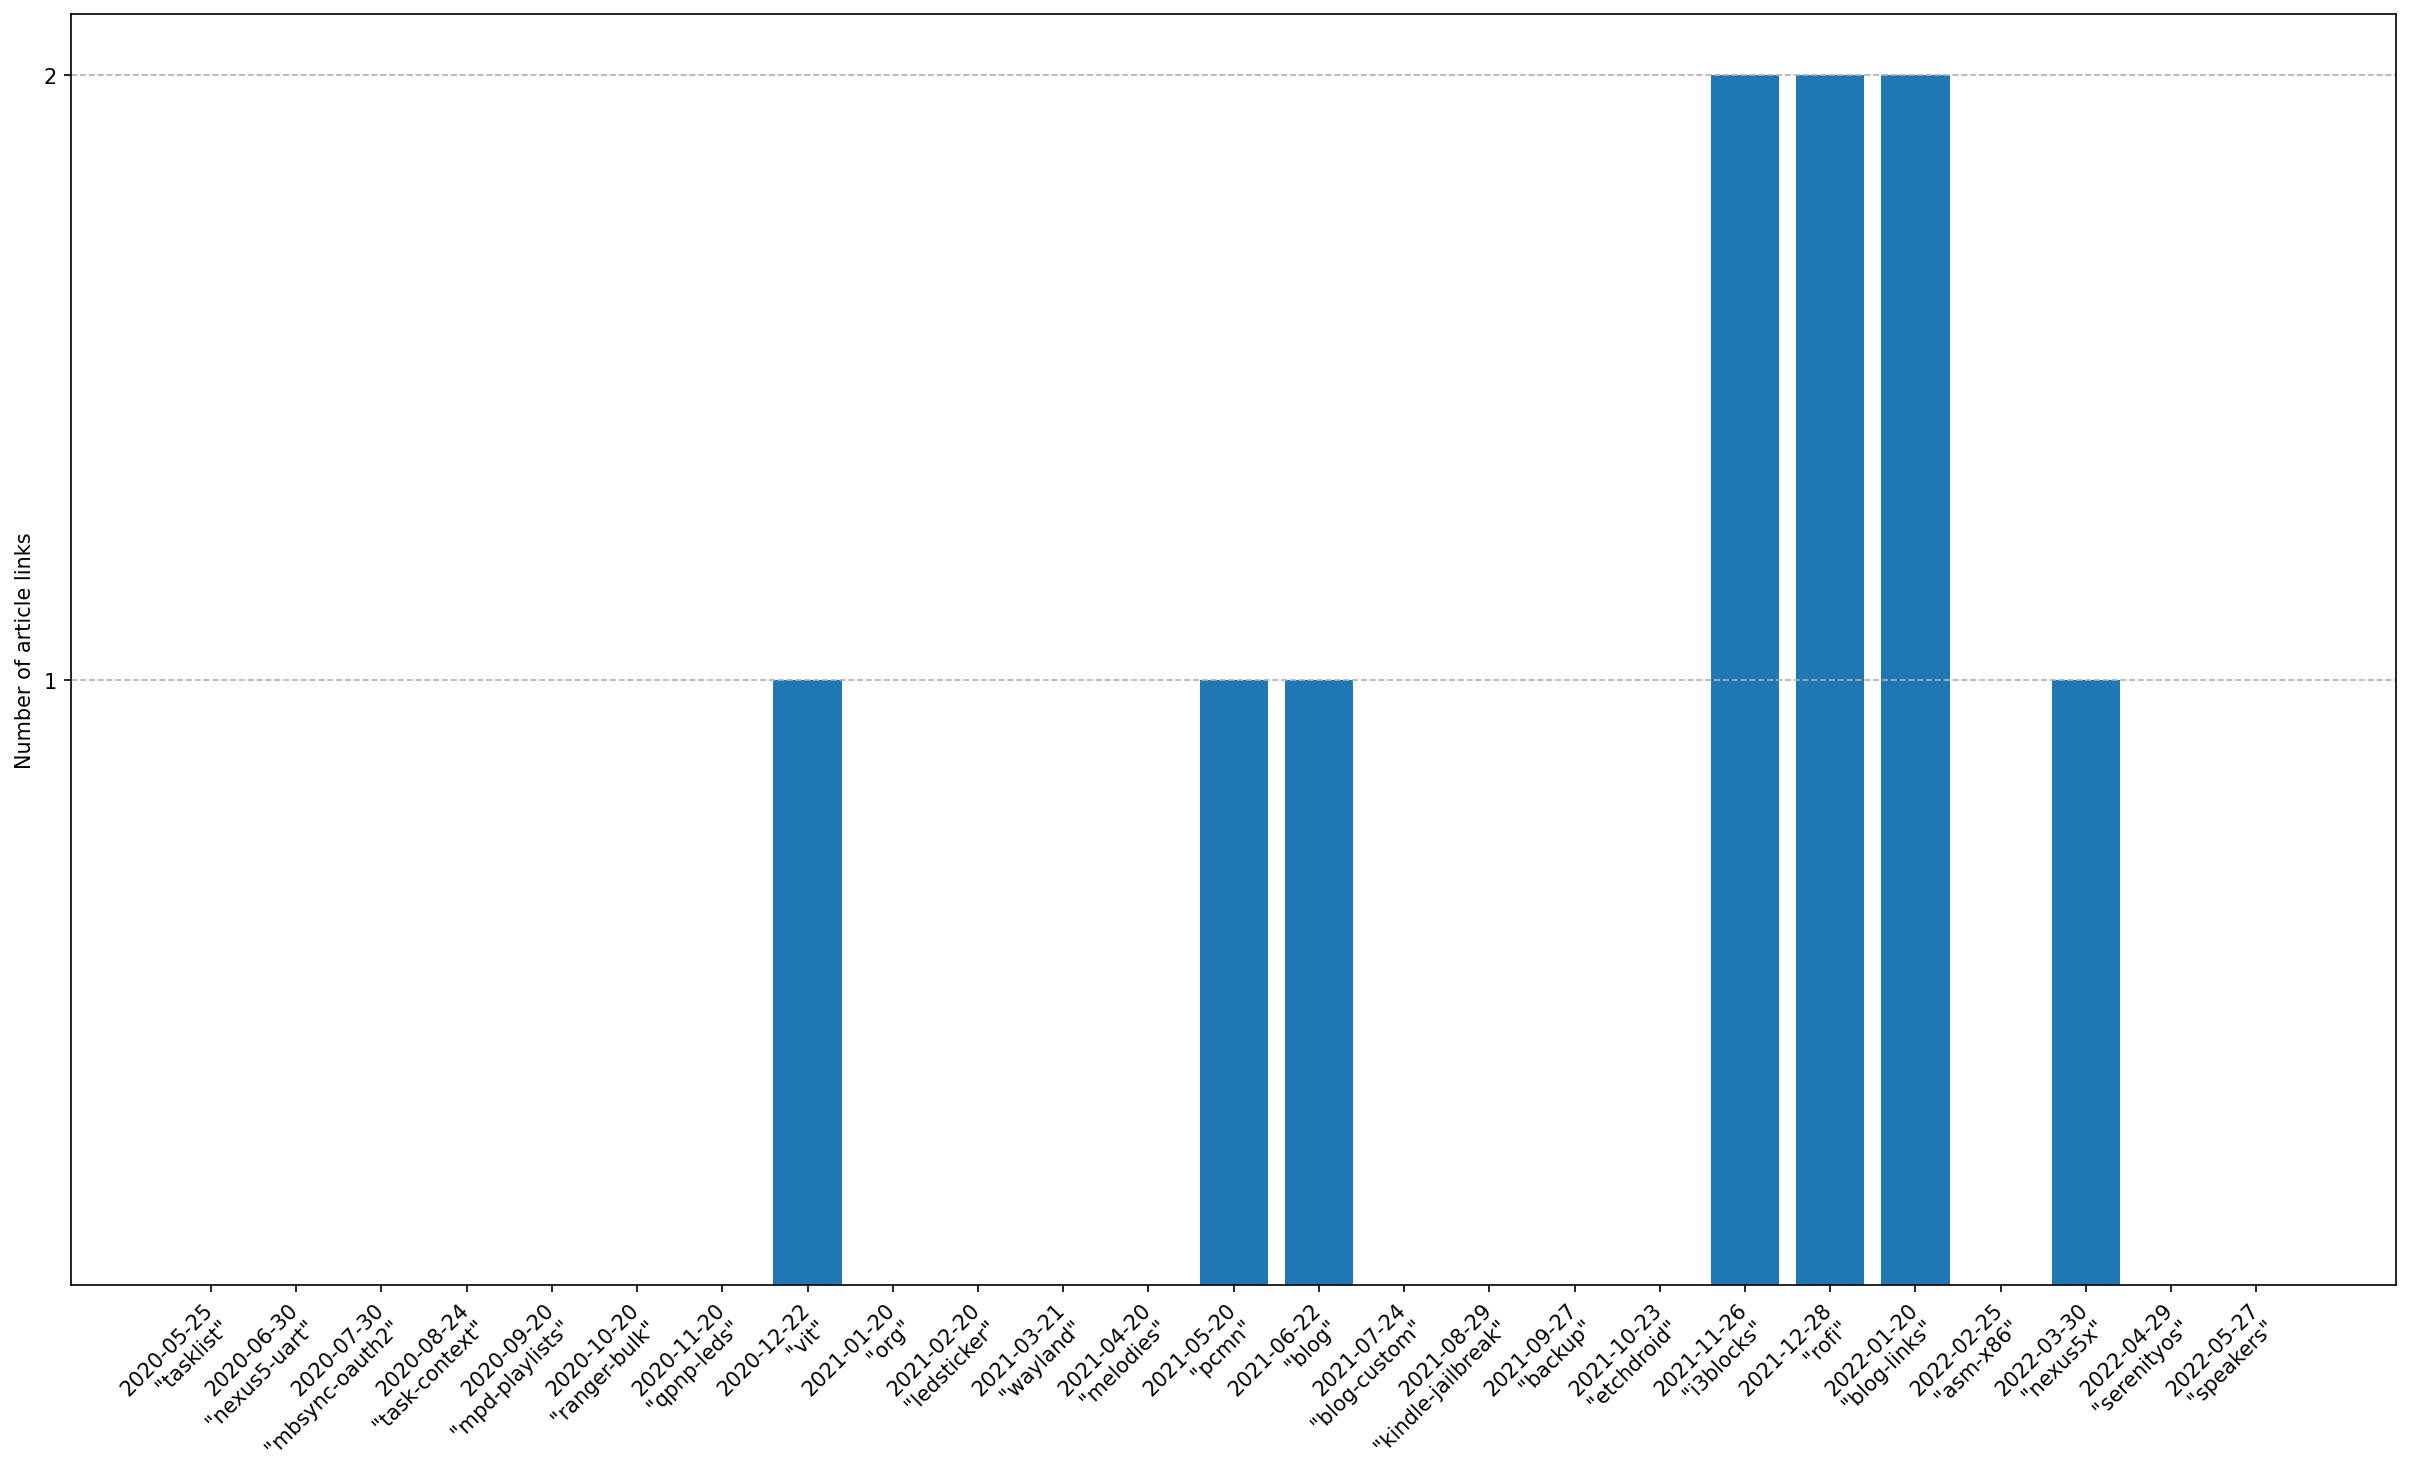
So most posts don't link to others (to be expected), and the ones that do only have a couple links at most. That said, this very post would be much higher than the rest on that plot, but I'd say it is an exception, since it's an introspective post about the blog.
What about any links?
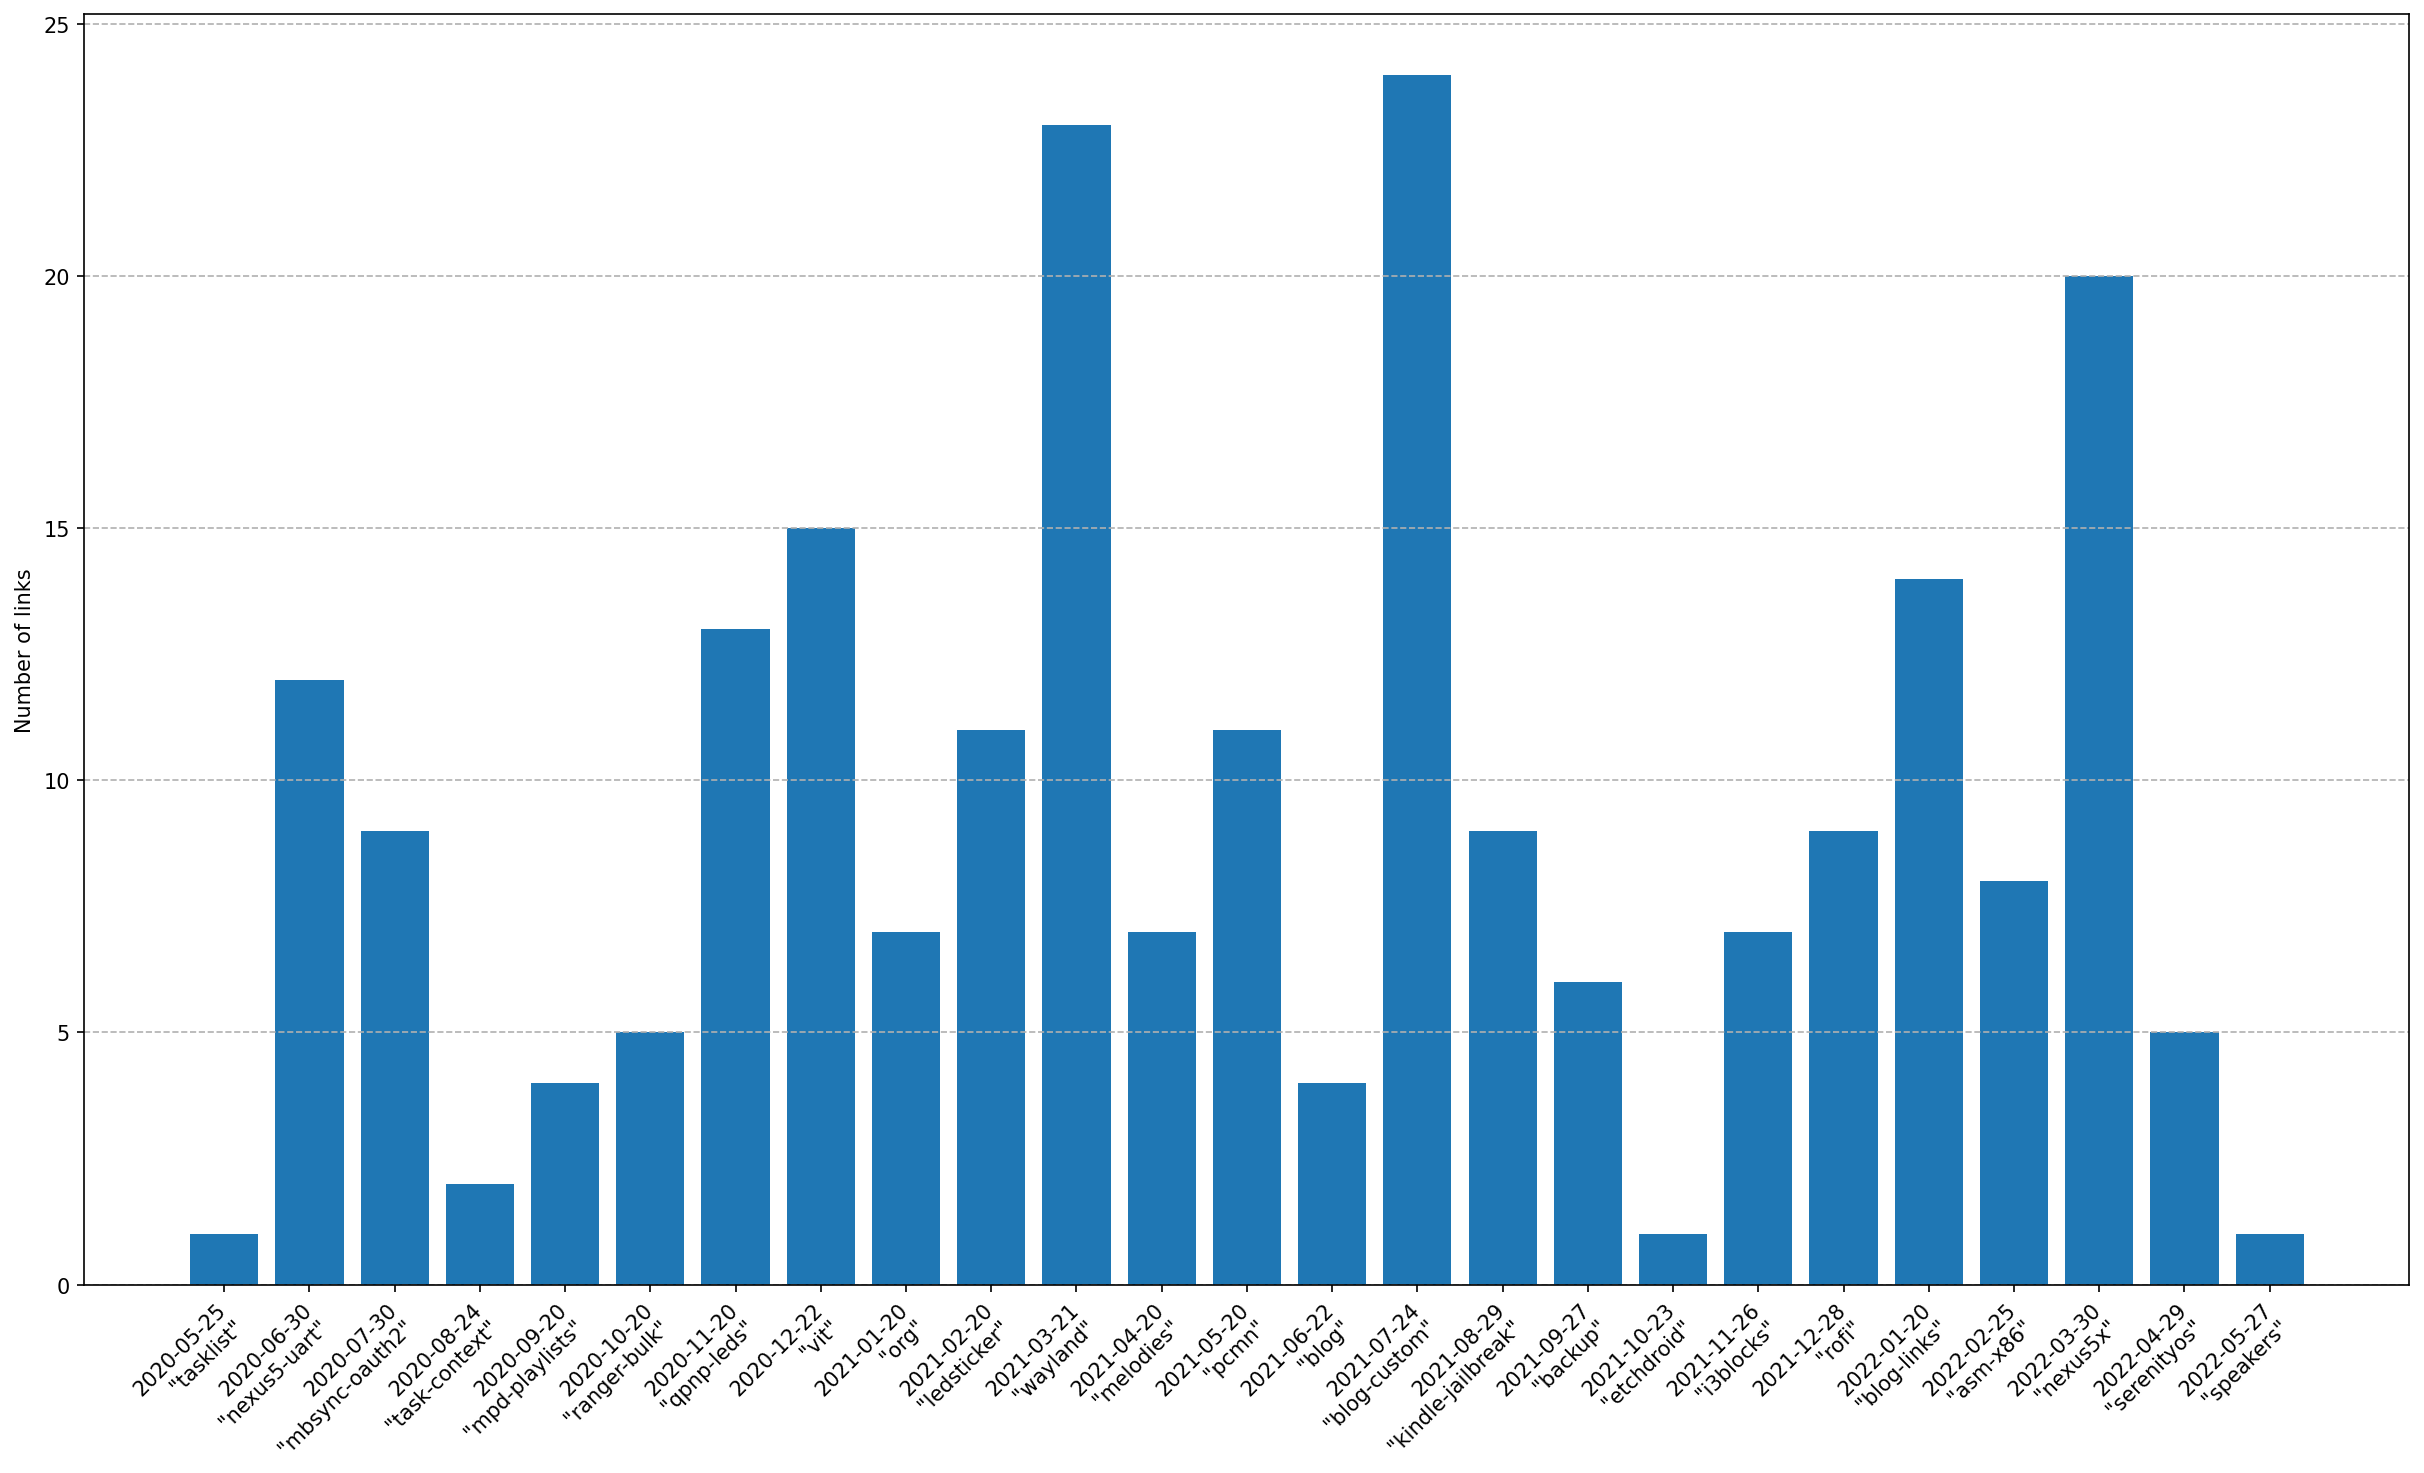
Every post has at least one link, which is not surprising in the least, this is the web after all!
And finally, the most important question, how many emojis??
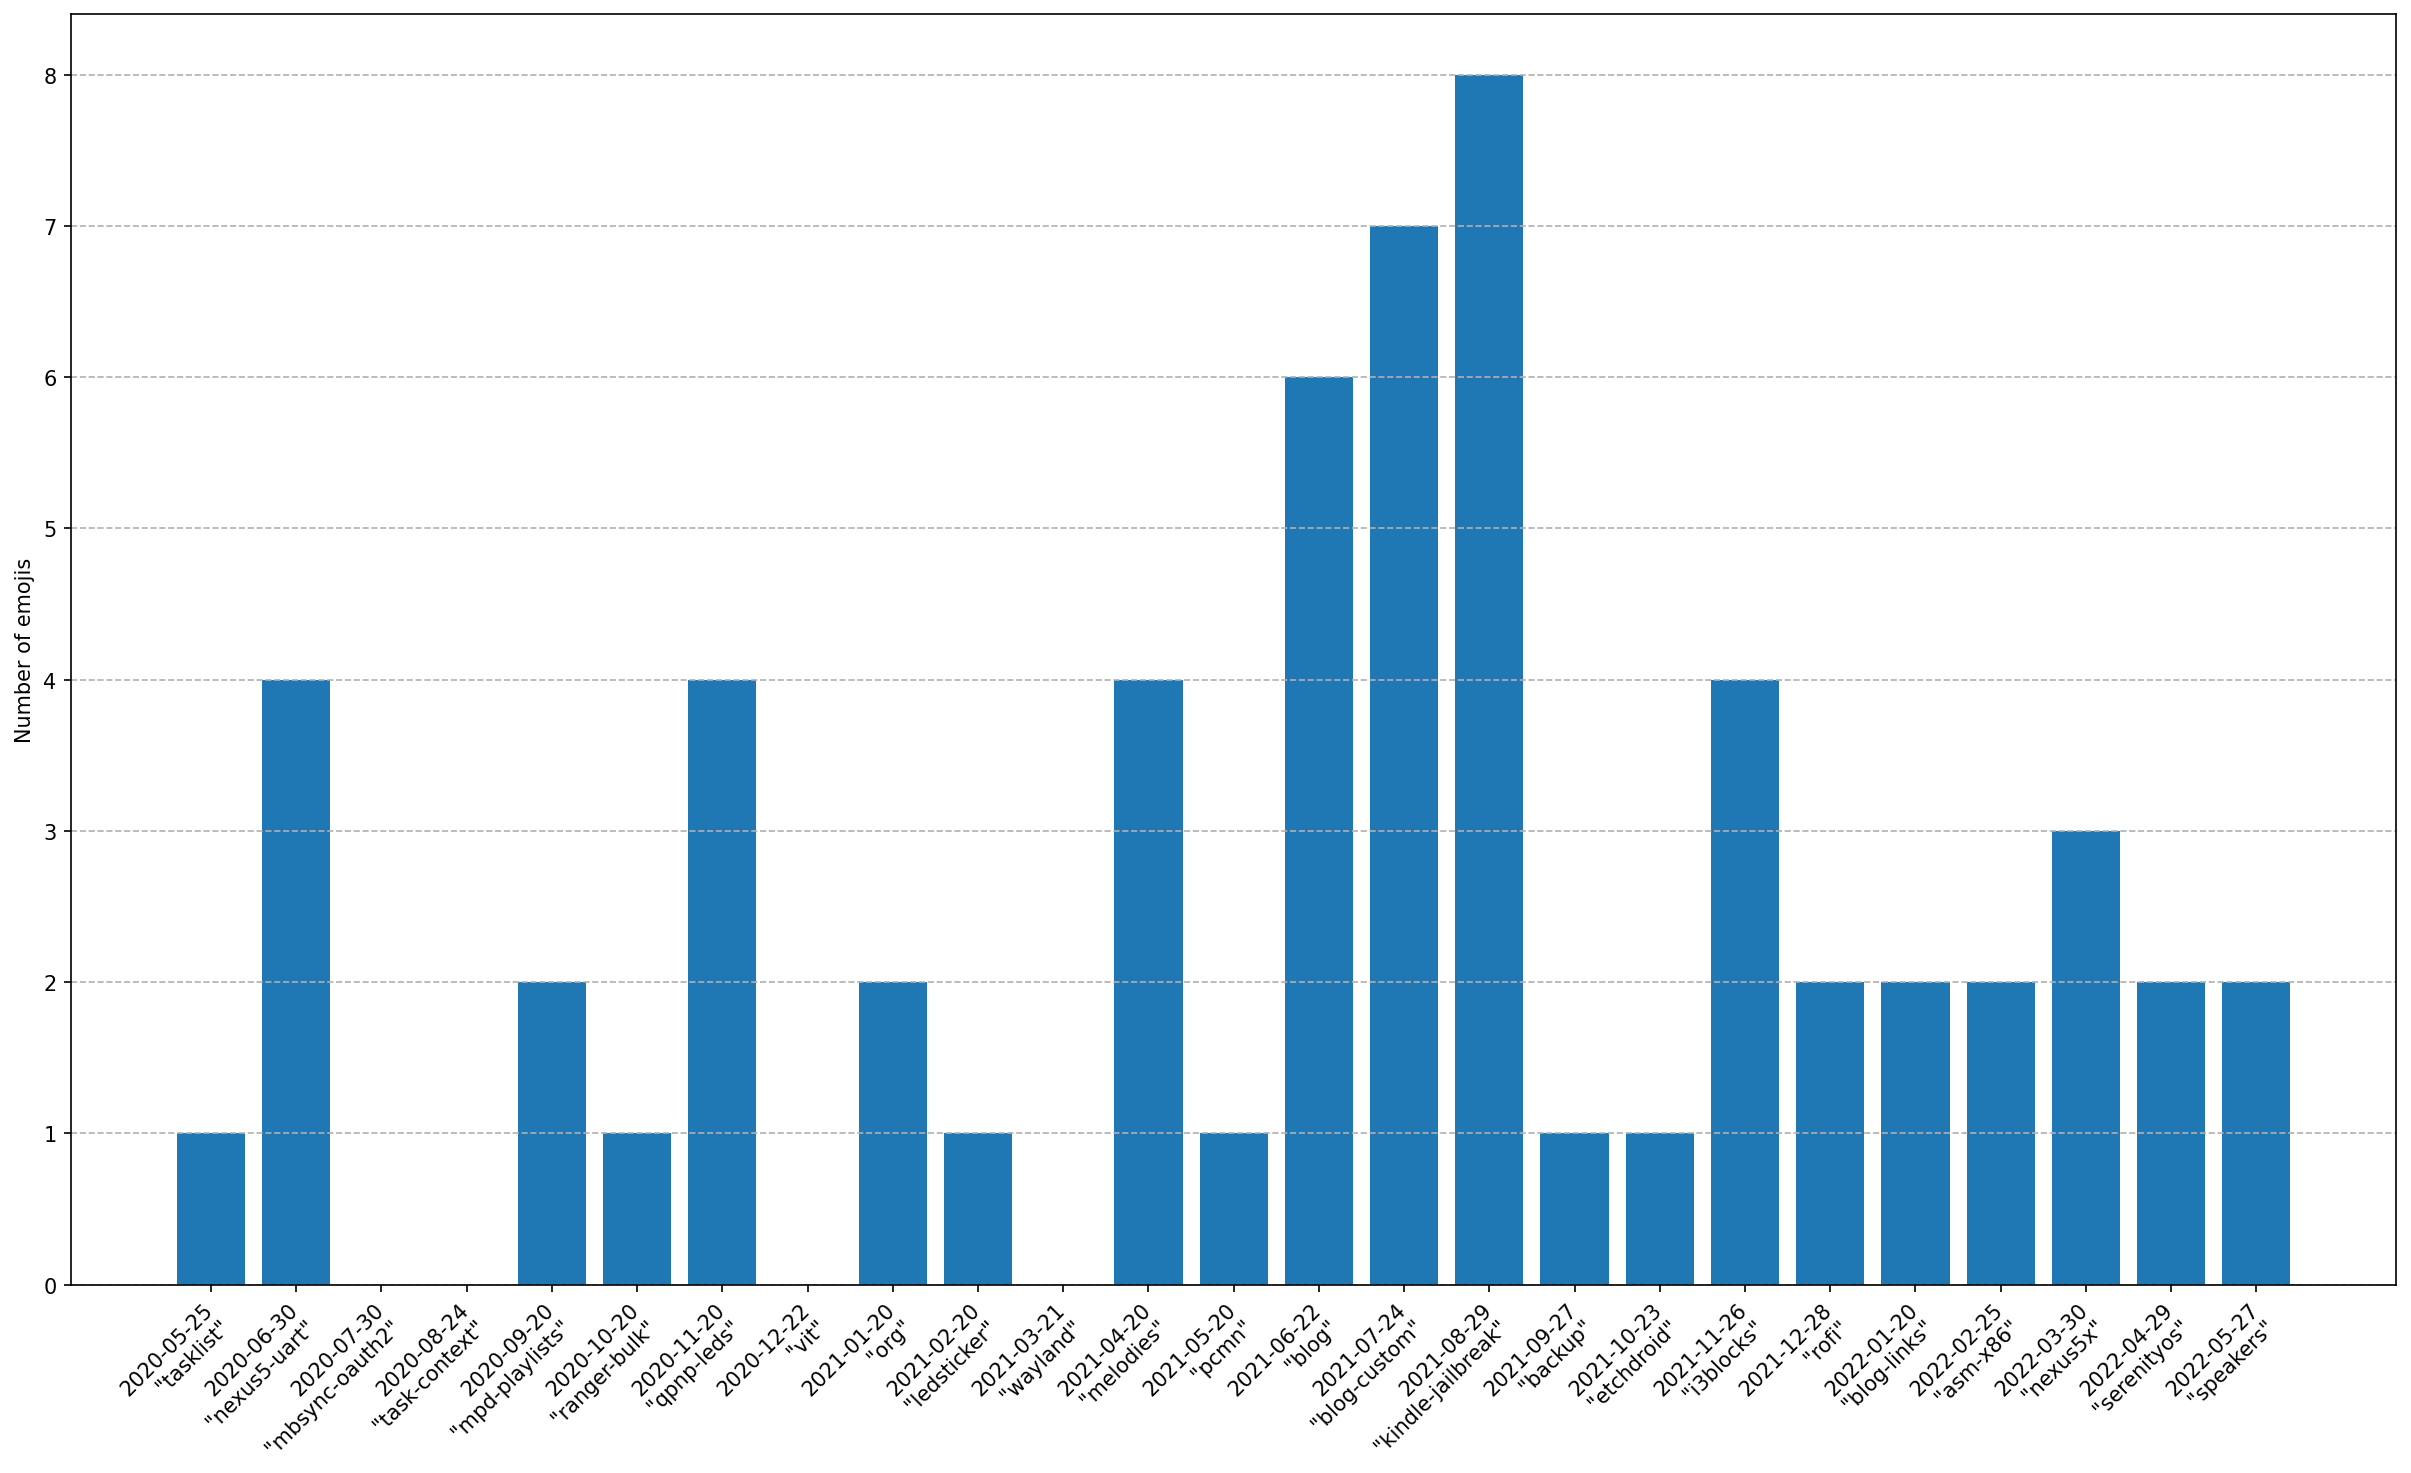
Not as common as links (thankfully?), but not bad either. I do seem to be getting more consistent in my emojis, whatever that means.
But how good is it to know how many emojis are being used if we can't see which ones?
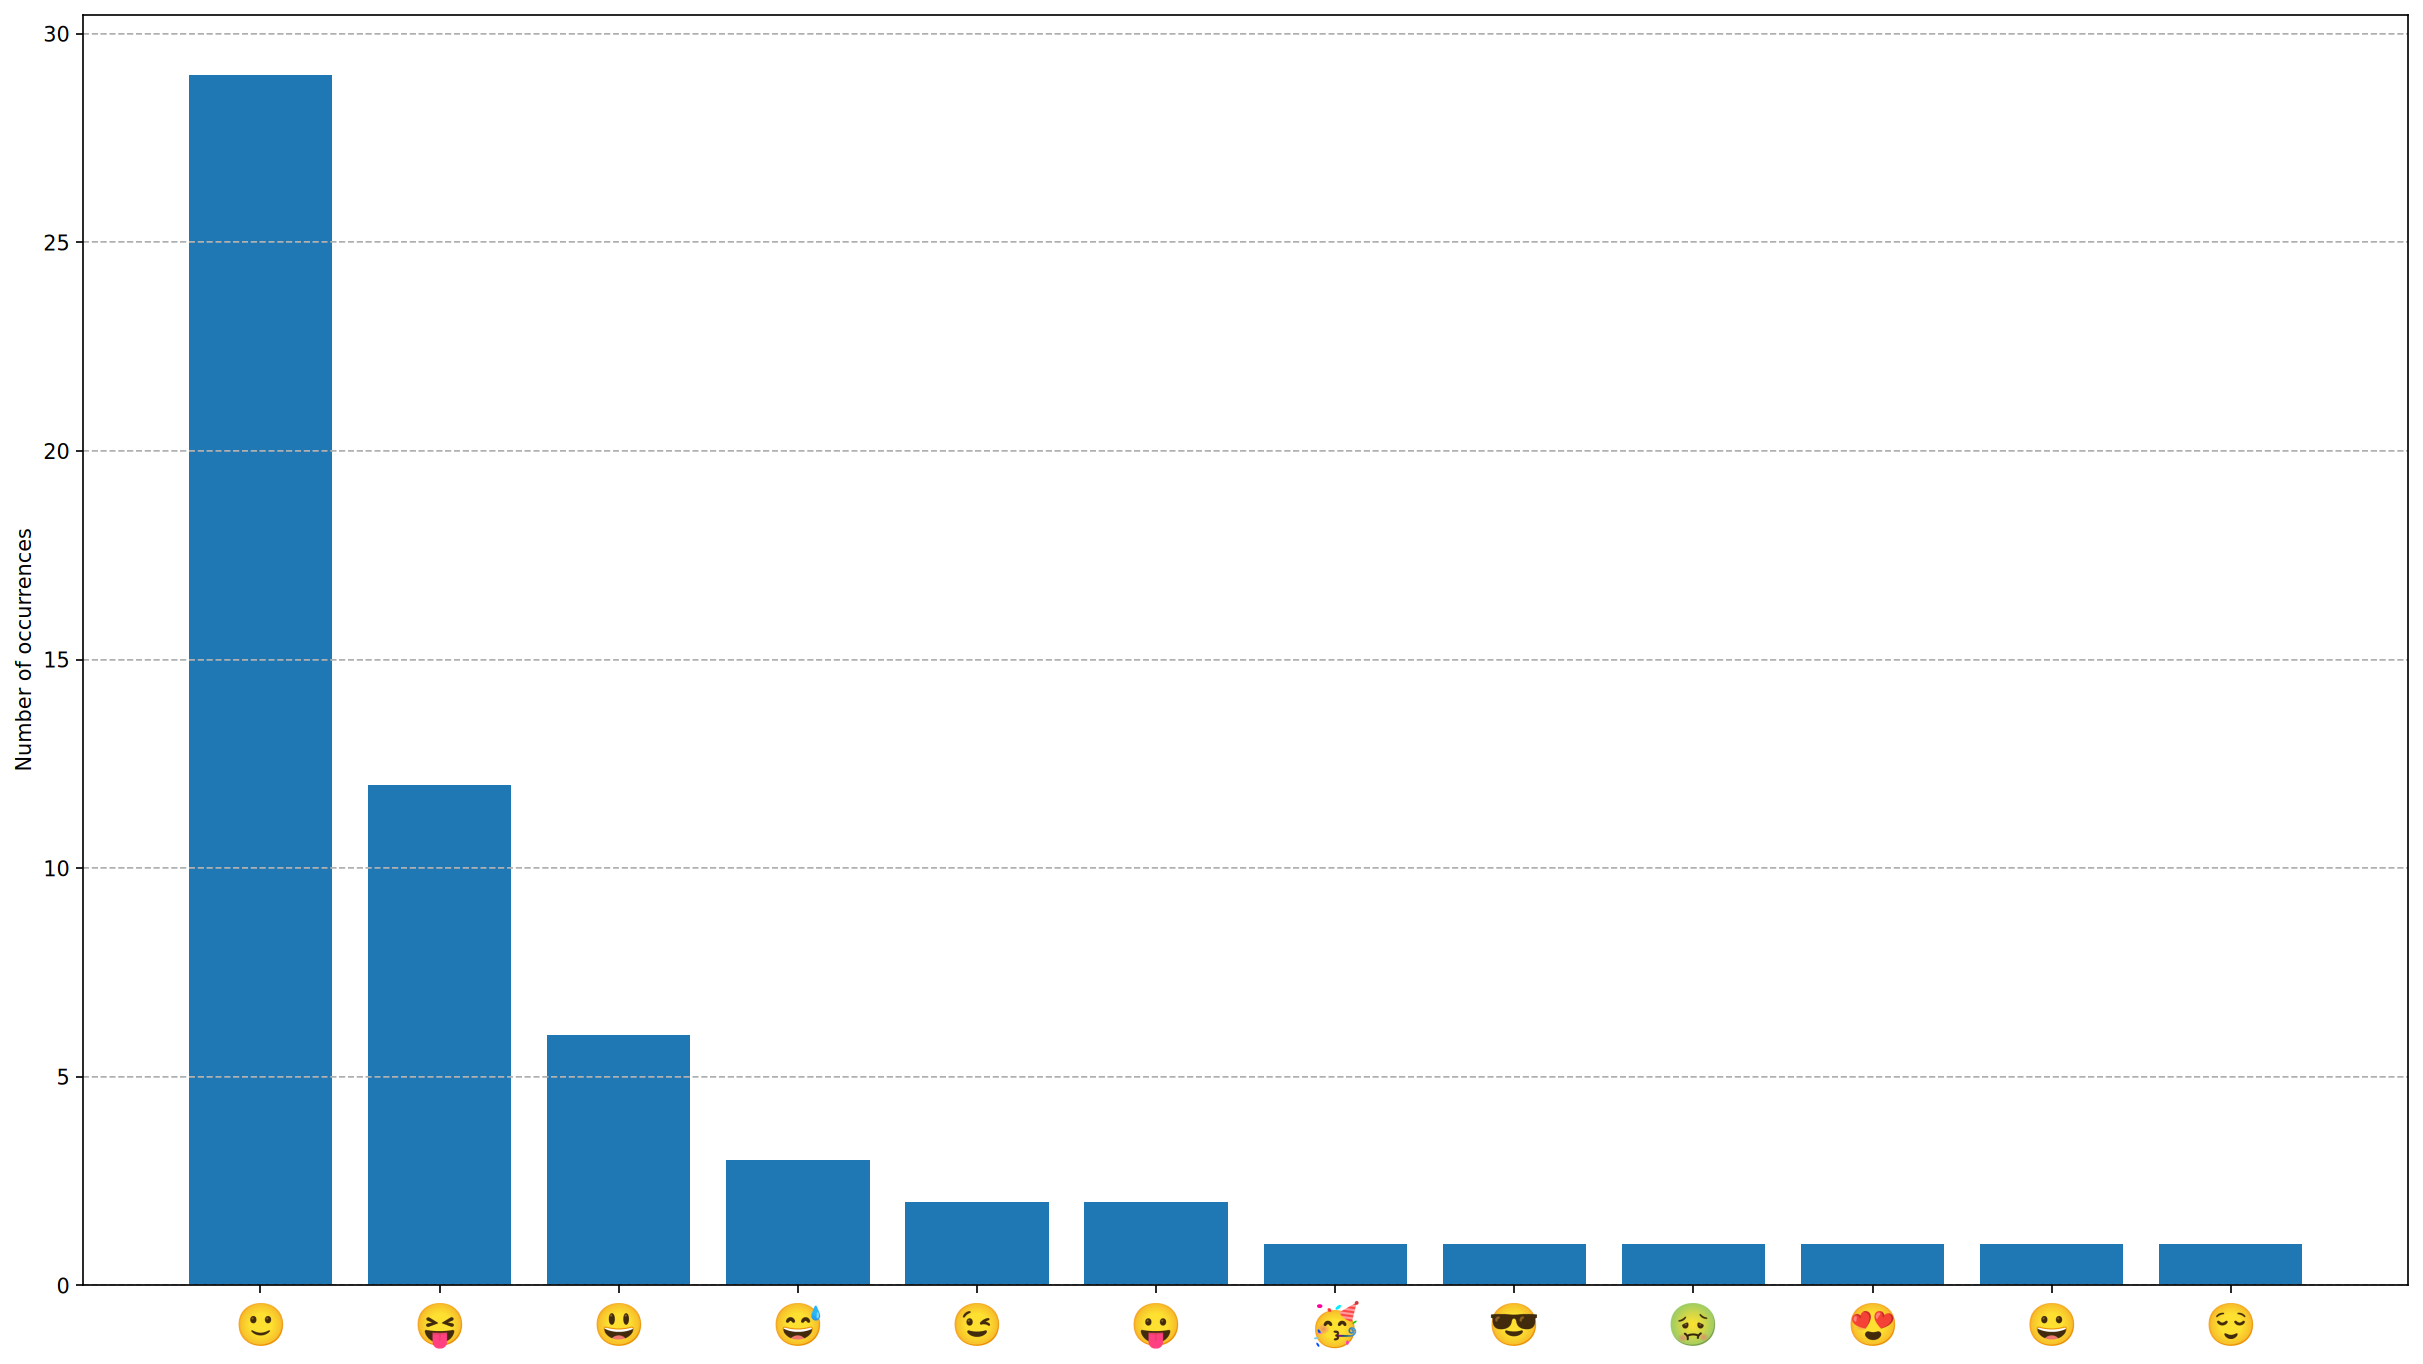
Of course the most common is the smiley face, hard not to smile when you're talking about something that you're interested in. On second place we have the tongue face for the funny moments. And a sprinkle of other random emojis.
This plot was way harder to do than it seems, but more about it next month (probably).
Conclusion
Even though it can be difficult to put myself to write about something every month, I really do enjoy the result. This monthly ritual turned out to be therapeutic to me, as I get the chance to build a new brick in this safe space that is my blog, so I feel like I'm advancing in my life even if nothing else happens.
The need for a post every month also encourages me to actually keep doing things that interest me, otherwise I'll end up without anything to write about!